Statistics
Question 1
The following shows the temperatures (high, low) and weather conditions in a given Sunday for some selected world cities. For the weather conditions, the following notations are used: c = clear; cl = cloudy; sh = showers; pc = partly cloudy.
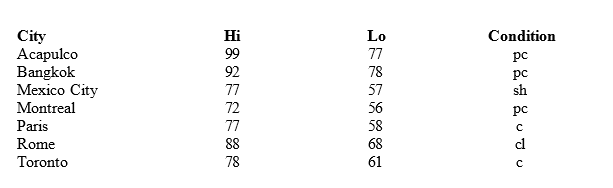
- How many elements are in this data set?
- How many variables are in this data set?
- How many observations are in this data set?
- Name the variables and indicate whether they are categorical or quantitative.
Question 2
A student has completed 20 courses in the School of Arts and Sciences. Her grades in the 20 courses are shown below.
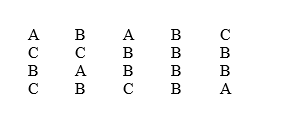
- Develop a frequency distribution and a bar chart for her grades.
- Develop a relative frequency distribution for her grades and construct a pie chart.
Question 3
The number of hours worked per week for a sample of ten students is shown below.
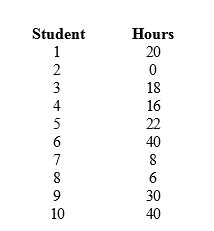
- Determine the median and explain its meaning.
- Compute the 70th percentile and explain its meaning.
- What is the mode of the above data? What does it signify?
Question 4
You are given the following information on Events A, B, C, and D.
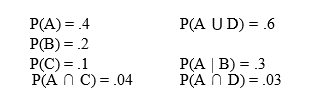
- Compute P(D).
- Compute P(A ∩ B).
- Compute P(A | C).
- Compute the probability of the complement of C.
- Are A and B mutually exclusive? Explain your answer.
- Are A and B independent? Explain your answer.
- Are A and C mutually exclusive? Explain your answer.
- Are A and C independent? Explain your answer.
Question 5
- When a particular machine is functioning properly, 80% of the items produced are non-defective.
- If three items are examined, what is the probability that one is defective?
- Use the binomial probability function to answer this question.
Question 6
The average starting salary of this year’s graduates of a large university (LU) is $20,000 with a standard deviation of $8,000. Furthermore, it is known that the starting salaries are normally distributed.
- What is the probability that a randomly selected LU graduate will have a starting salary of at least $30,400?
- Individuals with starting salaries of less than $15,600 receive a low income tax break. What percentage of the graduates will receive the tax break?
- What are the minimum and the maximum starting salaries of the middle 95.4% of the LU graduates?
Question 7
A simple random sample of 6 computer programmers in Houston, Texas revealed the sex of the programmers and the following information about their weekly incomes.
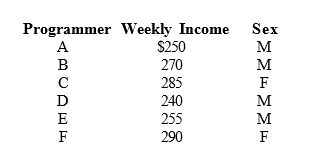
- What is the point estimate for the average weekly income of all the computer programmers in Houston?
- What is the point estimate for the standard deviation of the population?
- Determine a point estimate for the proportion of all programmers in Houston who are female.
Question 8
Students of a large university spend an average of $5 a day on lunch. The standard deviation of the expenditure is $3. A simple random sample of 36 students is taken.
- What are the expected value, standard deviation, and shape of the sampling distribution of the sample mean?
- What is the probability that the sample mean will be at least $4?
- What is the probability that the sample mean will be at least $5.90?
Question 9
In a poll of 600 voters in a campaign to eliminate non-returnable beverage containers, 210 of the voters were opposed. Develop a 92% confidence interval estimate for the proportion of all the voters who opposed the container control bill.
Question 10
A random sample of 87 airline pilots had an average yearly income of $99,400 with a standard deviation of $12,000.
- If we want to determine a 95% confidence interval for the average yearly income, what is the value of t?
- Develop a 95% confidence interval for the average yearly income of all pilots.
Question 11
In order to determine the average weight of carry-on luggage by passengers in airplanes, a sample of 25 pieces of carry-on luggage was collected and weighed. The average weight was 18 pounds. Assume that we know the standard deviation of the population to be 7.5 pounds.
- Determine a 97% confidence interval estimate for the mean weight of the carry-on luggage.
- Determine a 95% confidence interval estimate for the mean weight of the carry-on luggage.
Question 12
A statistician employed by a consumer testing organization reports that at 95% confidence he has determined that the true average content of the Uncola soft drinks is between 11.7 to 12.3 ounces. He further reports that his sample revealed an average content of 12 ounces, but he forgot to report the size of the sample he had selected. Assuming the standard deviation of the population is 1.28, determine the size of the sample.
Question 13
A sample of 81 account balances of a credit company showed an average balance of $1,200 with a standard deviation of $126.
- Formulate the hypotheses that can be used to determine whether the mean of all account balances is significantly different from $1,150.
- Compute the test statistic.
- Using the p-value approach, what is your conclusion? Let α = .05.
Question 14
During the recent primary elections, the democratic presidential candidate showed the following pre-election voter support in Alabama and Mississippi.
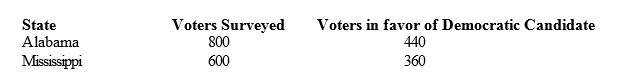
- We want to determine whether or not the proportions of voters favoring the Democratic candidate were the same in both states. Provide the hypotheses.
- Compute the test statistic.
- Determine the p-value; and at 95% confidence, test the above hypotheses.
Question 15
In order to estimate the difference between the yearly incomes of marketing managers in the East and West of the United States, the following information was gathered.
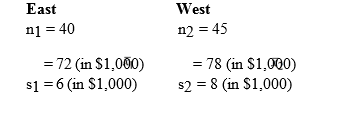
- Develop an interval estimate for the difference between the average yearly incomes of the marketing managers in the East and West. Use α = 0.05.
- At 95% confidence, use the p-value approach and test to determine if the average yearly income of marketing managers in the East is significantly different from the West.
